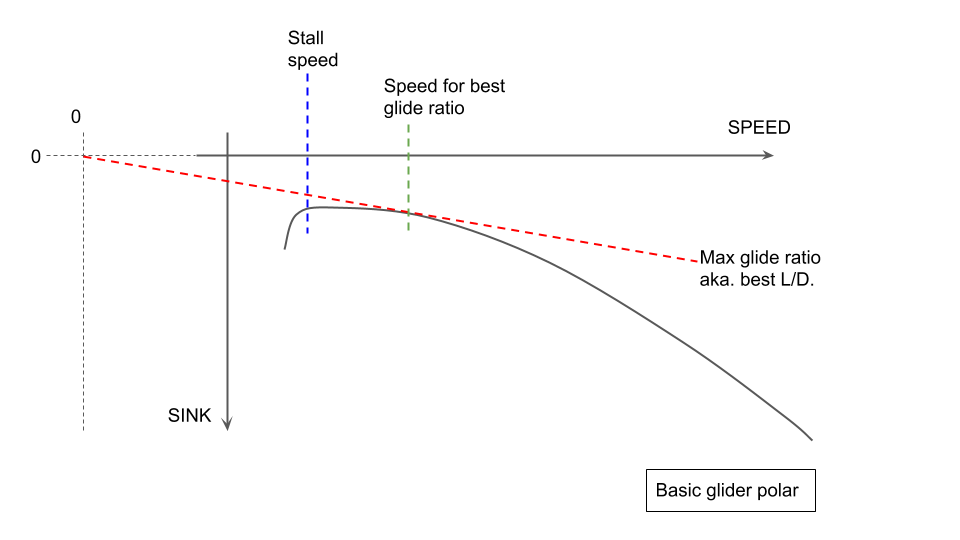
Simply put, the polar curve for an aircraft shows you how fast the aircraft will sink in the air for each forward speed. This performance curve needs to be modelled accurately in simulated sailplanes.
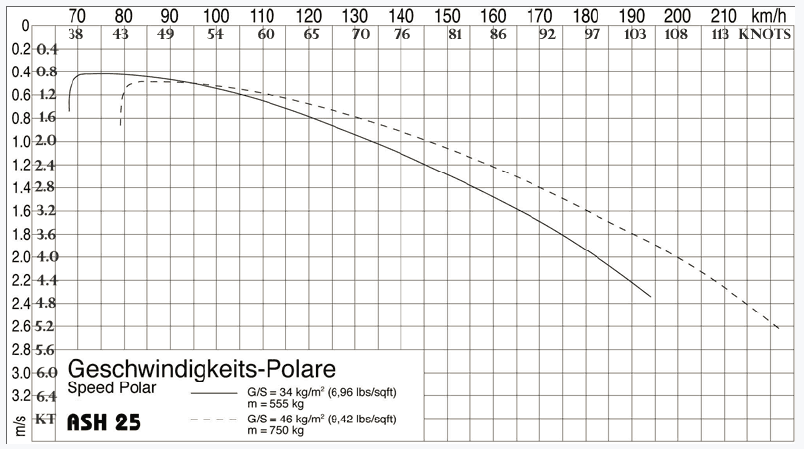
E.g. for the ASH25 Open Class sailplane:
This curve will be different for each model of aircraft, with a high-efficiency aircraft sinking less than a typical aircraft at the same forward speed. By this measure sailplanes are much more efficient than powered aircraft. For example, a modern glider of 18m span flying at 50 knots in still air will be sinking at about 1 knot and will be said to have a glide ratio of 50:1.
The glide performance of a given sailplane will alter according to its all-up weight and also its flap setting. Greater weight and/or a negative flap setting pushes the entire curve down and to the right, i.e. the glider can fly faster for a given amount of sink. This advantage in high-speed flight is complimented with a significant disadvantage when flying slowly. Many gliders carry water ballast, e.g. the ASW28 can carry 200Kg of water even though the aircraft has an empty weight of only 240Kg. This ballast provides exceptional high-speed performance but can be dumped in weak conditions. A pilot flying a sailplane with flaps will routinely be pushing the aircraft into negative flap when flying fast between thermals, and will pull the flaps back into a high positive setting when circling in a thermal. Flap settings may be referred to as (in order) Landing, Thermalling, Zero, Negative One, Negative Two. For any given speed there is an optimal choice for flap setting.
The polar curve at the top of this page is for the Schleicher ASH 25 25-meter high-performance sailplane which has flaps and carries water ballast:
The polar curve for the 25-meter ASH-25 shows a sink rate of 2m/s at a flying speed of 200km/h (In imperial measures that's 3.9knots sink at 108knots) for a glide ratio of about 28:1.
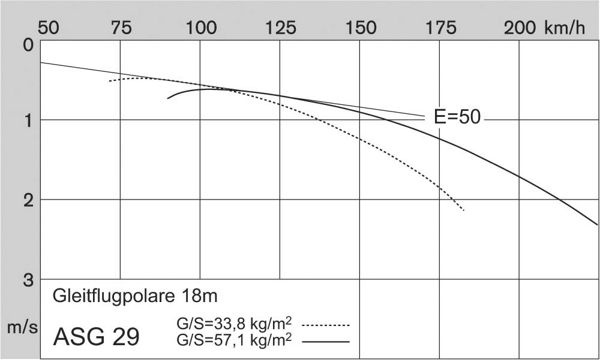
For comparison the polar curve below for the 18-meter ASW-29 shows it sinking at 1.75m/s at the same 200km/h flying speed, for a glide ratio of about 32:1. Counter-intuitively the cheaper smaller 18m sailplane is better at 200km/h than the ASH-25 25m sailplane. However, if conditions turn weak then the ASH-25 will win.
If you want your math to actually work, stick to SI units, i.e. "meters per second" for speeds (airspeed or sink), "meters" for distance (e.g. distance travelled or height gained or lost), "kilograms" for weight. The internal math has nothing to do with the number the needle on a cockpit gauge will point to, i.e. "meters" can trivially be converted to "feet" for the altimeter, or "meters per second" to "knots" or "kilometers per hour" for the ASI. Americans are have a track record of cluelessness in this regard so we end up with FSX speed simvars in a random mix of units (such as "feet per minute" and "knots", so be careful) and NASA has satellites off Mars crashing because force units of Slugs per Banjo or whatever were mixed up with Newtons.
The basic sailplane polar is illustrated above. This is basically as 'advertised' by the manufacturer but you will see below this performance is actually one curve (the best) from an overlapping set of curves given different flight parameters. In still air, the glider sink rate is affected by at least the following:
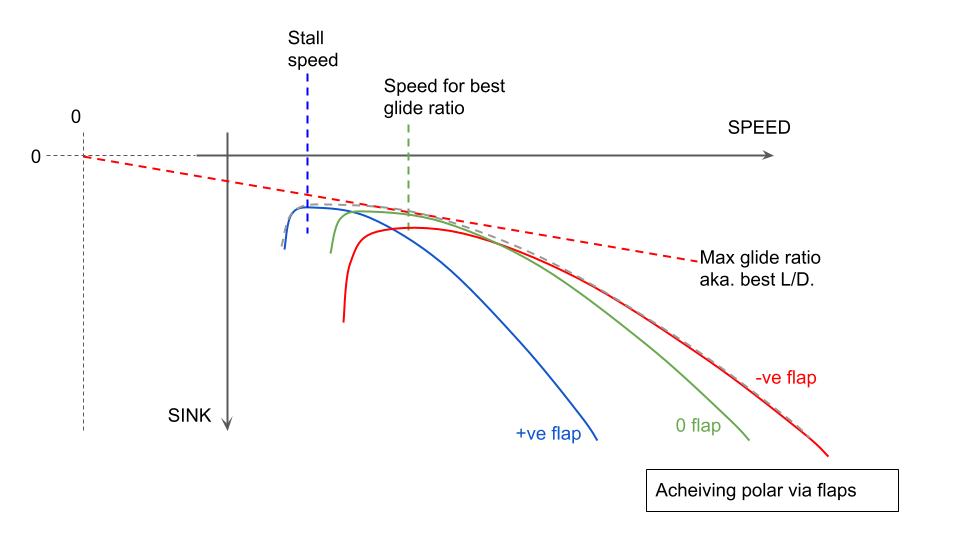
In a flapped glider, the manufacture will still publish the 'polar', but that will actually be a best-performance composite of flying with the best flap setting for each speed segment, i.e. positive flaps at the low speed end, and negative flaps at the high speed end. The diagram above illustrates the multiple "flap polars" that combine to produce the best overall envelope (only three flap settings have been used for the illustration, in practice any flapped glider will have more).
Typical flap settings for a sailplane might be described (ignoring actual flap degrees) as:
L - landing flap. An extreme positive flap setting with a low stall speed, high lift and high drag for a low speed controlled approach to a landing. These will typically have the aerodynamic effect of lowering the nose of the sailplane (at each airspeed) also. Designed assuming zero ballast as that is required to be dumped before any landing.
+2 - thermalling flap for tight slow circling. Positive flap for slow circling in narrow thermals.
+1 - thermalling flap for more gentle circling.
0 - zero flap for max L/D.
-1 - cruise flap (negative) for moderate speeds faster than best L/D.
-2 - negative flap for racing speeds (e.g. 80knots/150kph +)
You can see from the illustration above how the polar curve for each flap setting overlaps with the others, and the crossing points represent the optimal speeds to change flaps.
It is the outermost envelope of the multiple flap polars which is used as the overall 'polar curve' for the aircraft.
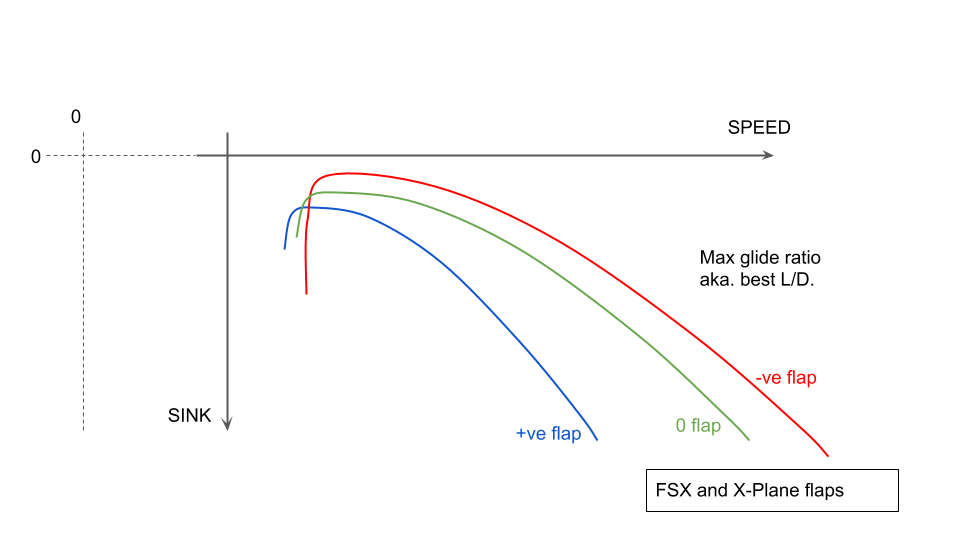
The flap flight model implementations in FSX, X-Plane and (probably) MSFS model the flaps separately from the main wing. I.e. they are additional panels with their own lift/drag curves. For MSFS Asobo have made a great play of using the FSX flight model but increasing the number of panels that are (still independently) simulated.
It seems the consequence of this modelling is that the effect of the flap setting on the overall aircraft polar is more consistent across the entire speed range, such that the flap polars do not intersect at any speed above the stall. This means the best glide performance is only available to the overall best flap setting (normally zero) at all speeds, and it makes sense to fly the entire flight at this flap setting.
The simulated positive flap settings do lower the stall speed, so they make sense to use during a landing.
In sailplanes, flaps are ultra-high-aspect-ratio airfoils (e.g. 10 meters long and 10cm wide) which also affect the aerodynamic properties of the main wing.
Existing FSX, X-Plane, MSFS flaps work great for Cessnas and Airbuses with their 0..positive flap ranges and large square flap surfaces intended primarily for providing a very large increase in lift and drag (more than a sailplane landing flap).
Flapped sim sailplanes without this active control would actually be best flown by setting the 'best' flap throughout the entire
flight and the flaps are irrelevant for soaring. Much worse is the fact that most sim sailplanes can be flown at low speed in
the wrong flap setting and achieve huge glide ratios (e.g. 100:1).
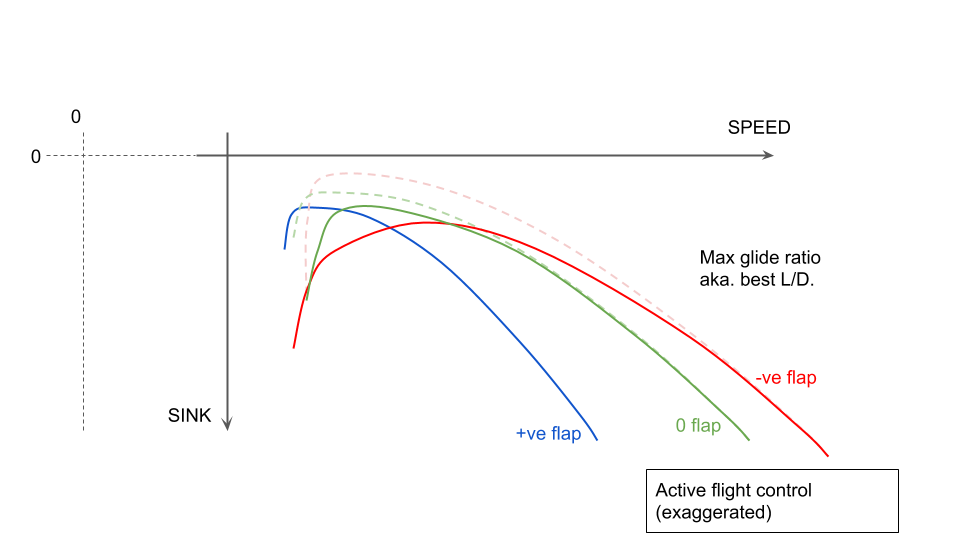
Using e.g. flight_model.cfg the sailplane can be modelled with (say) +2 flaps which give the correct glide at low speed, and (say) -2 flaps which give the correct glide for most of the polar curve above the max L/D speed.
At this point the simulated -2 flap setting will be giving a better L/D ratio at slow speed than the +2 setting (i.e. the +2 setting is correct at low speed, but the -2 setting is wrong). We aim to correct the low-speed -2 flap error via active flight control, more below.
The flightmodel 'degrees of flaps' used for these settings is completely independent of whatever is shown to the sim pilot, e.g. in labelling and moving the flap lever, or animating the flap deflection on the wings. For FSX and X-Plane it seems best to start with 0 degrees for -2, and move positive from there (while animating negative flap). The starting point may be an aircraft model which is animating directly on flap deflection degrees but that can be swapped for another simvar implemented specifically as part of the active flight control code.
The automated adjustment is relatively simple. Gauge code (or other embedded code) can monitor the airspeed and flap setting (i.e. 'index') and use a lookup table/formula to control the 'spoiler handle position'. Experimentation will show that the spoilers can be cracked open a small amount (try 1%) and that will be sufficient to bleed energy from the aircraft to correct the low-speed polar.
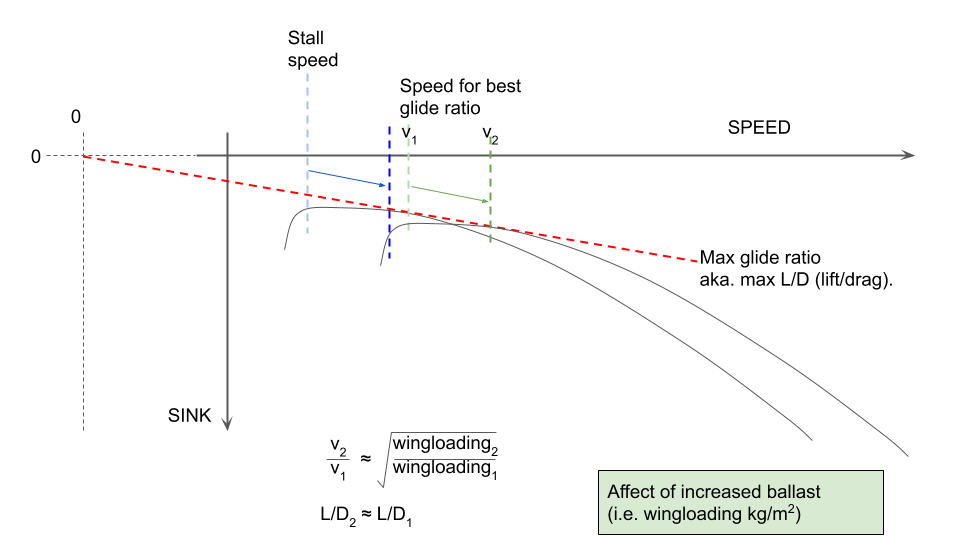
As above, increased weight in the sailplane will push the polar curve down and to the right, sliding along the 'best L/D' line. In other words if a glider has a best glide ratio of 50 and ballast is added, then the ballasted glider will still have a best glide ratio of 50 but this will happen at a faster speed (and the sailplane will be sinking faster).
For the actual polar shift the increase in flying speed (and sink) is proportional to the square root of the increase in wing loading. E.g. a glider with wing-area 10.8m, wing-loading 36kg/m^2 and best L/D at 56knots (my ASW24), if ballasted with 150 liters of water (i.e. 150Kg/10.8m^2 = +13.9Kg/m^2) then the polar speed (and sink) increase is sqrt(49.9/36) = 1.18. So the new 'best L/D' speed will be 56*1.18 = 66knots.
Note: wing loading is simply a convenient way to refer to 'weight' which kinda normalises between different aircraft (of a similar type). As the the wing area doesn't typically change, adding 100kg of weight (ballast) to a sailplane with 10m^2 wing area is an increase in wing loading of 10kg/m^2 and you get used to the idea of the unballasted wing loading (say 35kg/m^2) or the max all-up wing loading (say 50kg/m^2) being broadly comparable among racing gliders although they may have different wing spans, masses, and wing areas.
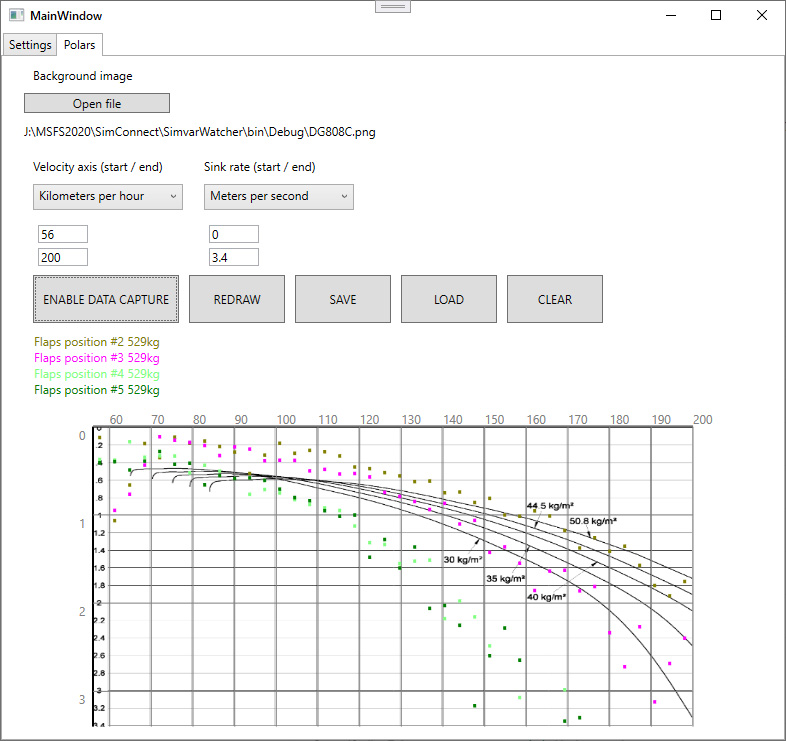
This entire page would be largely hypothetical if it were not for the availability of tools to measure/display the polar performance of any aircraft in the sim.
For X-Plane we have B21_Analysis
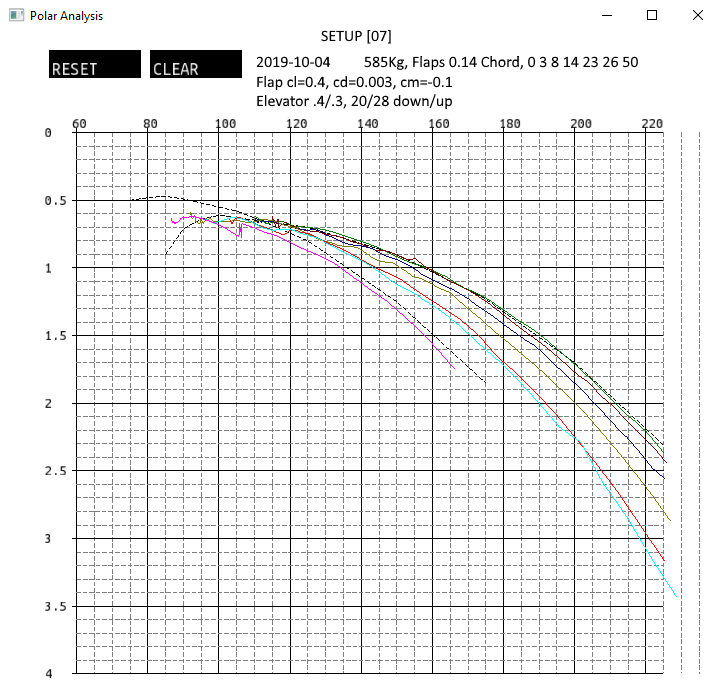
For MSFS we have SimPolars. The screenshot below is from a work-in-progress (2020-12-28) and doesn't properly represent the awesome program as completed.